Average house prices in the UK have increased by 4.6% in the 12 months to December 2024, provisional data from the Office for National Statistics shows. The annual growth rate has increased from the 3.9% recorded in November, as an average house in the UK costs £268,000.
In England, average house prices have not changed on the month, but have seen a 4.3% change on the year, with average properties now costing £291,000. In Wales, house prices declined by 0.5% in the last month of 2024, falling to an average price of £208,000.
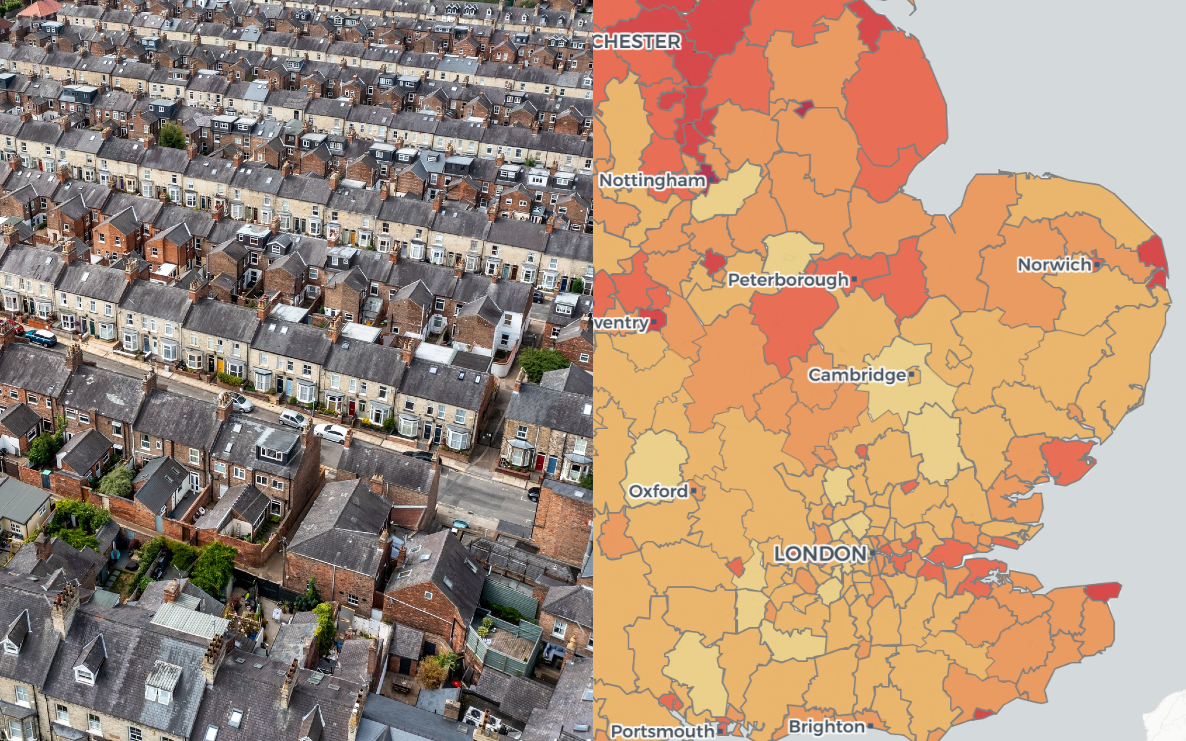
At a local level, London had the highest house prices in 2024. In Kensington and Chelsea, property prices averaged at £1,224,130 per property, whilst in Westminster and Camden they averaged at £984,104 and £830,953 respectively. Conversely, Burnley (£114,122), Inverclyde (£126,656) and East Ayrshire (£127,038) reported the lowest property prices in the country.
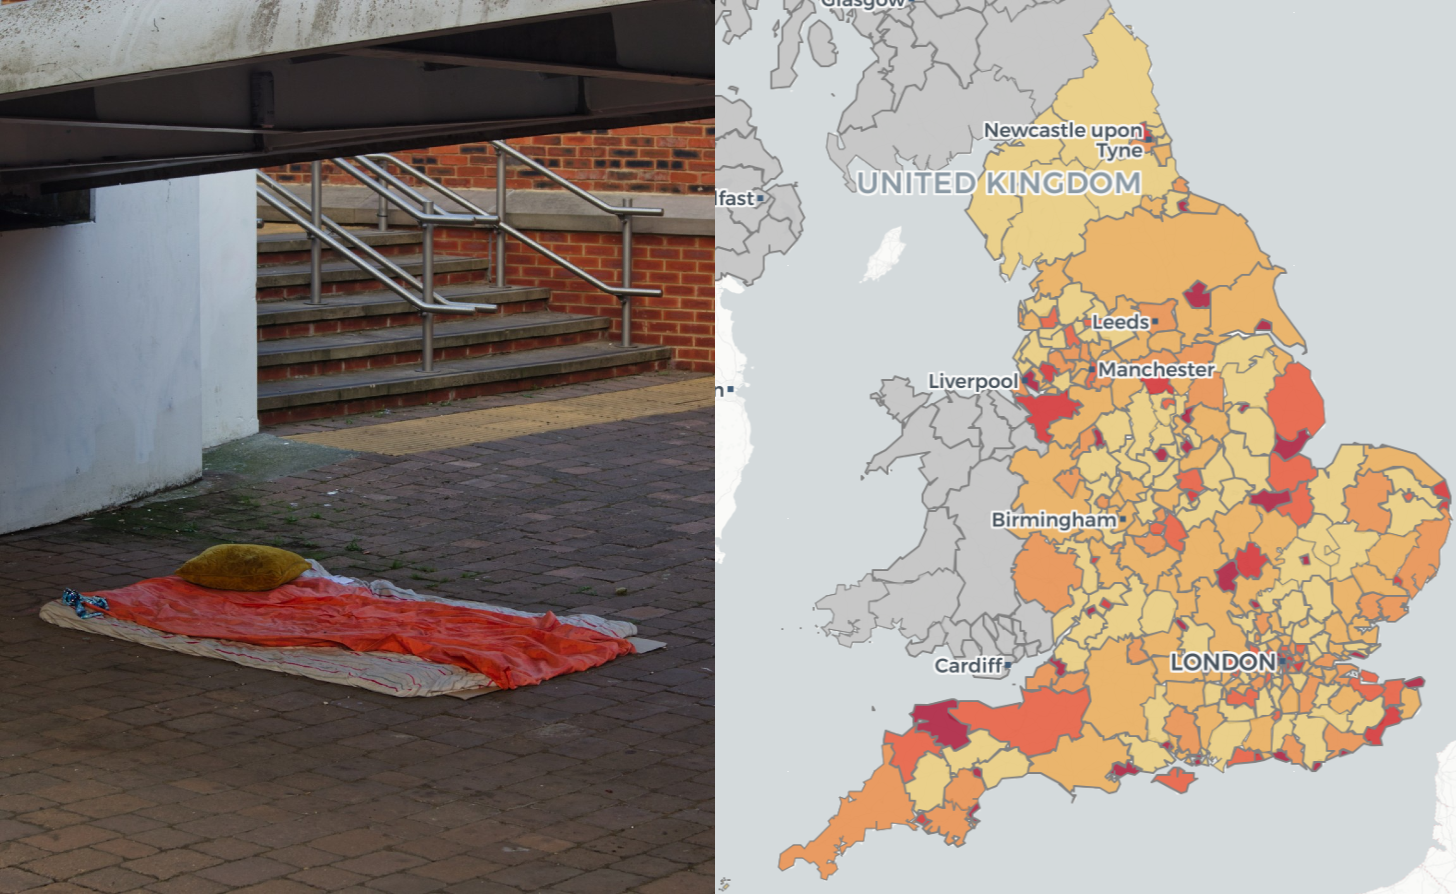
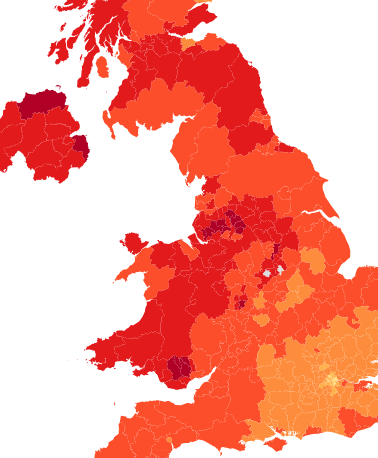
In the UK, house prices have increased 20% in the last 5 years. The highest percentage change was in Orkney Islands and Blaenau Gwent, where house prices increased by more than 40% in 2024 from 2020. However, some areas have seen a fall in average dwelling prices in the past few years. Kensington and Chelsea, City of London, Aberdeen City, Southwark, Tower Hamlets and Camden have all recorded value declines in percentage terms from 2020 prices.
Data viewpoints
Richard Donnell, executive director at Zoopla: “It Is positive that average earnings continue to rise faster than house prices, helping to reset housing affordability and improve access to the market.”
Richard Harrison, head of mortgages at Atom Bank: “The latest ONS figures underline what a strong year 2024 was for house price growth, with prices rising at their fastest rate since February 2023. Even with the unwelcome news of resurgent inflation, it is unlikely that 2025 will be much different. Record high house prices have become the norm, and I expect this trend to continue.”
Ross Turrell, commercial director at CHL Mortgages: “Today’s data adds to a growing list of reasons for optimism about the UK property sector. With annual growth holding strong at 4.6% and the Bank of England’s recent rate cut fuelling demand, there is a real sense that market activity is ramping up. As a result, buyers and investors are showing renewed confidence, and market momentum is building.”
About this map
The map below highlights percentage changes in house prices and shows house prices per year, using data from the Office for National Statistics (ONS). To explore detailed figures for your area, double-click on the map or click here to view the full-page version.