The Ministry of Housing, Communities and Local Government (MHCLG) has announced that the next iteration of the Index of Multiple Deprivation (IMD) for England is set for release on the 30th of October of this year.
This highly anticipated statistical release follows a competitive tender process, with Oxford Consultants for Social Inclusion (OCSI) co-leading the project once again.
Launched in the early 2000s, the IMD has been a bedrock resource, providing relative measures of deprivation for small areas across England. This upcoming 2025 update, the latest in a series of releases, will continue to be a vital tool for understanding the nuanced challenges faced by communities nationwide.
The English Indices of Deprivation explained
The Index of Multiple Deprivation (IMD) is a MHCLG report that measures deprivation levels in small areas across England. The most recent iteration was calculated across different domains, each weighting differently to produce the final measure:
- Income deprivation (22.5%)
- Employment deprivation (22.5%)
- Education, skills and training deprivation (13.5%)
- Health deprivation and disability (13.5%)
- Crime (9.3%)
- Barriers to housing and services (9.3%)
- Living environment deprivation (9.3%)
Information from the seven domains was combined to produce an overall relative measure of deprivation score. The IMD scores are then used to rank areas in England from most to least deprived. The dataset includes both ranking of small output areas and of local authorities.
In addition to the overall deprivation ranking and score, the release also provides individual scores for each domain.
What does it mean for Geo-advocacy?
The IMD is a powerful tool for geo-advocacy, painting a clear local picture of deprivation in England:
- By scoring and ranking lower output areas, it gives significantly localised insights, allowing charities to understand where to target support.
- In providing separate data for each domain, such as housing, income and education, it drives understanding of which resources are most needed in each area.
- When used concurrently with other publicly available data sources it helps build links between different social, economic and political challenges.
Most notably, the IMD enables organisations and researchers to gain a deeper understanding of community-specific issues, allowing them to leverage local deprivation data to shape policy at both the local level and in parliament.
What did we learn from the last index?
In 2019, Blackpool was named as the most deprived area in the country, scoring highest in income and employment deprivation. Conversely, Hart was named as the least deprived area. Despite facing higher barriers to housing and services, the local authority scores significantly well in income, employment and health.
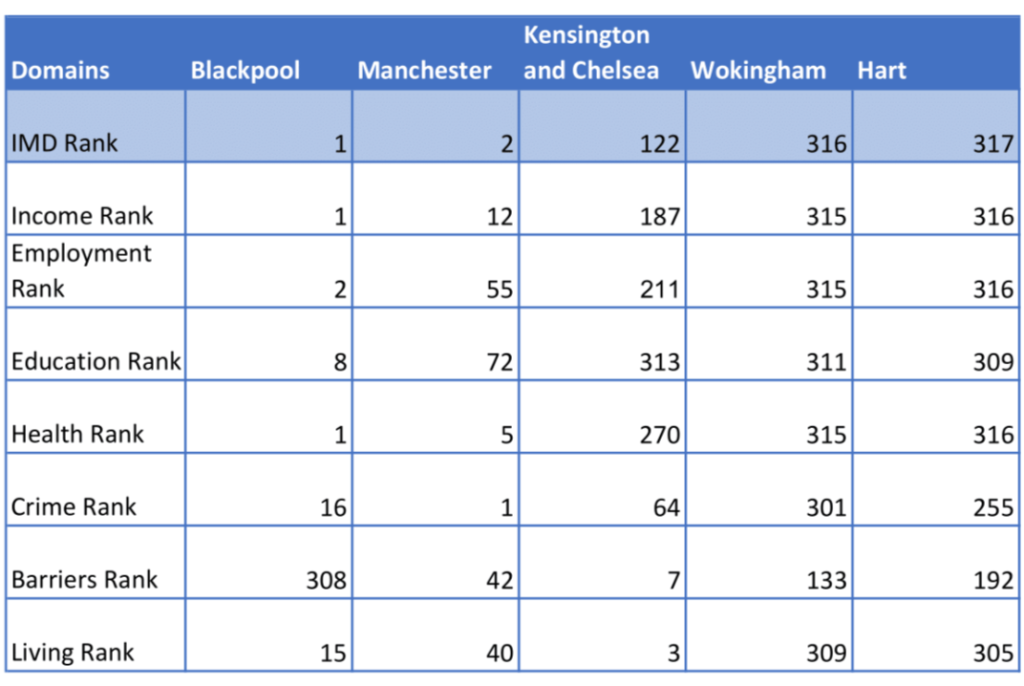
These figures alone help build a picture of deprivation in Blackpool, Hart and beyond. However, incorporating additional figures can further broaden this understanding.
Drawing from publicly available data, it is possible to build a more comprehensive and nuanced picture of how deprivation intersects with other key indicators.
The data below represents the latest available figures for each indicator on local authority boundaries.
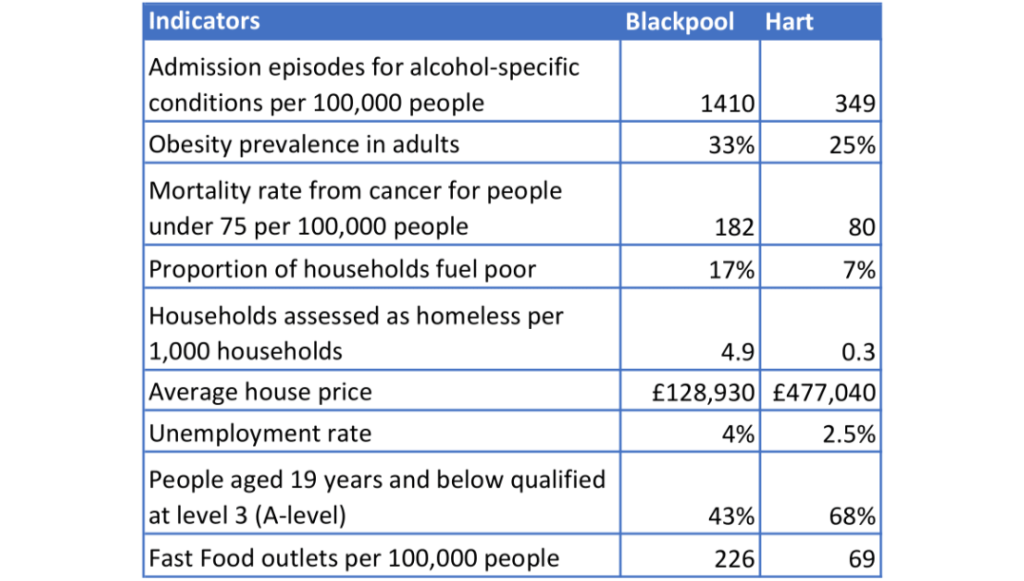
Comparing the most and least deprived areas reveals stark divides across various indicators. Alcoholism and obesity, for instance, demonstrate clear disparities between the two local authorities.
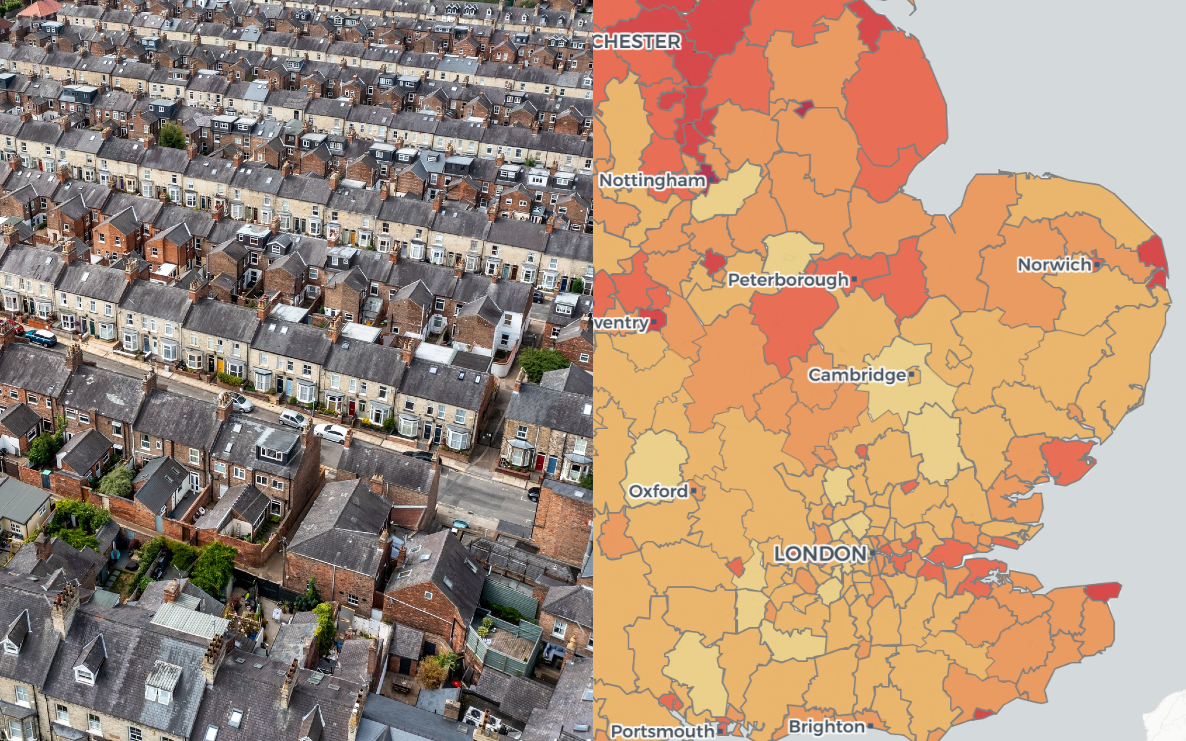
Visualising deprivation at constituency level
The data team at Polimapper has visualised the 2019 English Indices of Deprivation by Westminster Constituency, showing each area ranked from most deprived (rank 1) to least (rank 10).
The visualisation also displays demographic data for each constituency. The metrics cover age, country of birth, ethnic group, religion, housing tenure, fuel poverty and employment.
To explore statistics in your area double click on the map or click here to launch the full page visualisation.
The future of the IMD in England
According to the Ministry of Housing, Communities and Local Government, the IMD 2025 is set to be released on the 30th of October 2025, with OCSI and Deprivation.org co-leading the research.
The new iteration seeks to review, update, enhance and develop the English Indices of Deprivation. Besides taking into consideration lessons from previous releases, it will also reflect insights gathered through a user consultation in 2022. Additionally, research will be made in collaboration with the Department for Environment, Food and Rural Affairs (DEFRA) to improve how deprivation in rural areas is measured.
Stefan Noble, Director and Head of Research at OCSI, writes: “The indices are a critical tool for understanding inequalities across local areas in England. Updating them ensures the continued accuracy and relevance of data used by policymakers, local authorities, and community organisations.”