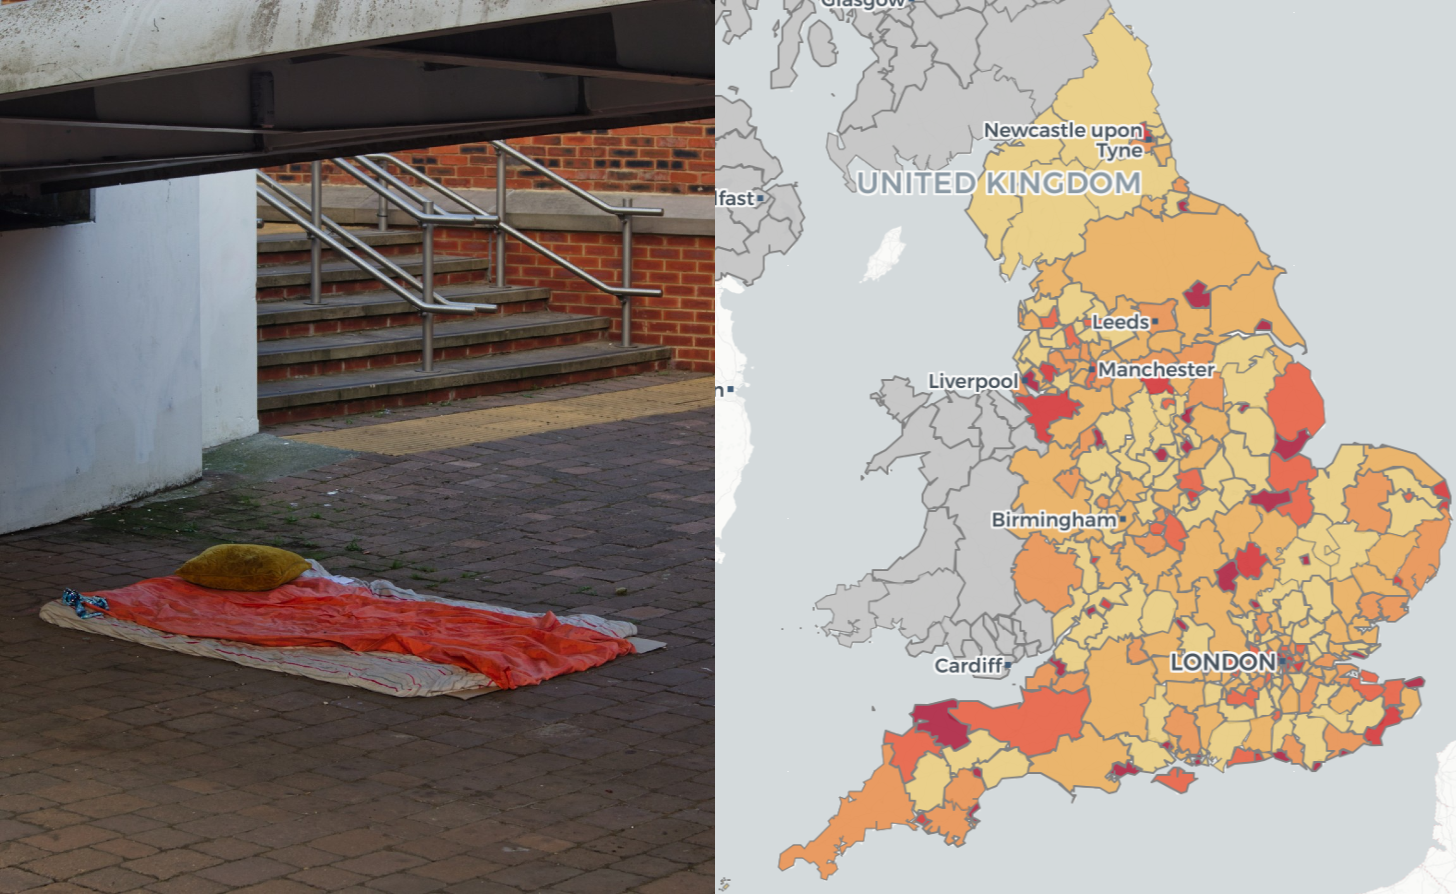
Premature mortality rates remain higher in poorest districts, with Blackpool and Manchester leading the national rankings for both deprivation and early deaths.
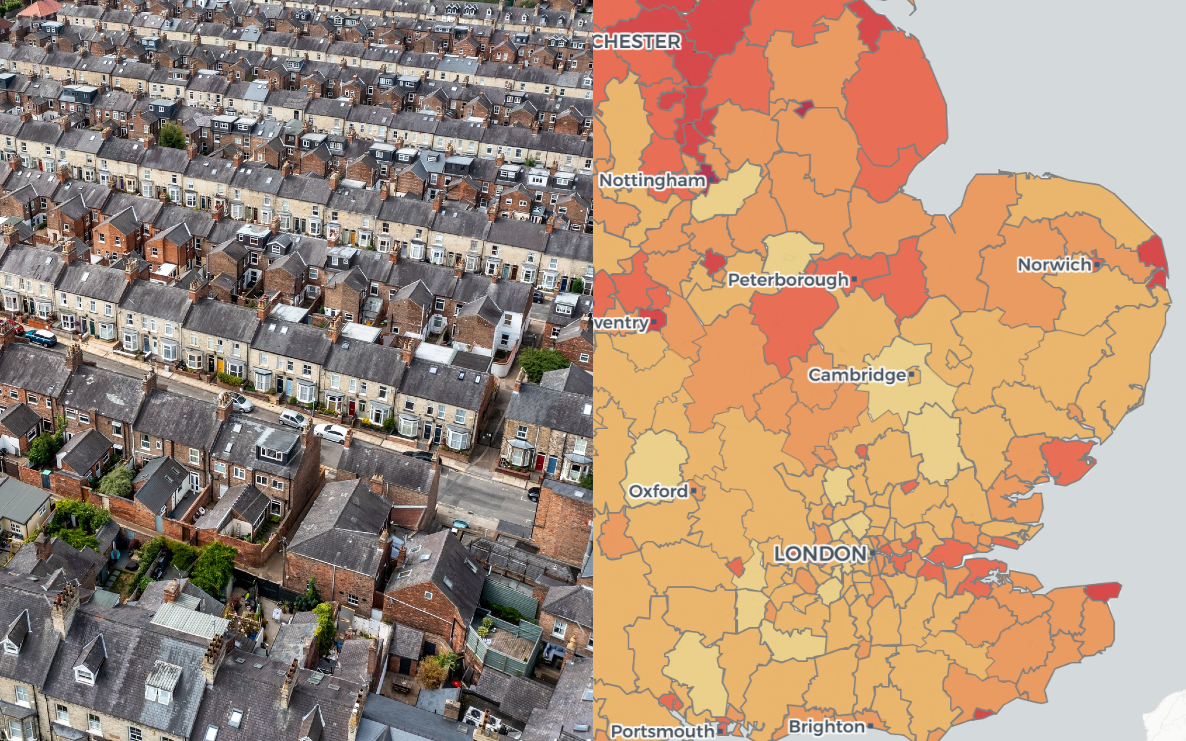
In this visualisation, we have mapped mortality rates for all causes and by disease type for 2024 at local authority level. To explore statistics in your area, double click on the map or use the search bar. Alternatively, click here.
Geodata analysis
The Office for Health Improvement and Disparities (OHID) has released updated local authority mortality figures. These reveal key geographical trends that closely mirror the Index of Multiple Deprivation (IMD), recently published by the Ministry of Housing, Communities and Local Government.
The Polimapper data team has analysed these datasets to highlight the most significant correlations.
Blackpool retains the country’s highest mortality rate for the fourth consecutive year, recording 1,230 deaths per 100,000 in 2024. Crucially, the district also suffers the highest rate of premature mortality in England, a statistic that aligns with its ranking as the country’s most deprived area.
Manchester trails closely behind, recording a mortality rate of 1,238 per 100,000 and ranking second in national deprivation levels.
Conversely, Hart recorded the nation’s lowest figures for both all-cause, all-age mortality (654 per 100,000) and premature mortality (192 per 100,000). Mirroring the national trend, Hart is ranked as the least deprived area in the 2025 IMD.
Richmond upon Thames and Waverley, both situated within the top 20 least deprived areas, similarly exhibit significantly lower rates of premature mortality.
Collectively, cancer, cardiovascular disease, respiratory disease, dementia, and Alzheimer’s disease accounted for 74% of all mortality in England in 2024.