Every ten years, the census captures detailed information about communities across the United Kingdom. It’s one of the most reliable sources of public data, giving policymakers and practitioners in health, education and research, a powerful, population-level view of how we live. In this article, we explore how census data for England and Wales can be harnessed to create health insights at both local and national levels and examine how these can support geo-advocacy for targeted investment, better service provision, and improved health outcomes.
How the census captures health and care
The census gathers self-reported insights into people’s health, disabilities, and caring responsibilities.
Disability
Respondents answer a two-step question:
- Do you have any physical or mental health conditions or illnesses lasting or expected to last 12 months or more?
- If yes: Do these conditions reduce your ability to carry out day-to-day activities?
This two-step approach produces five categories ranging from no long-term condition to disabilities that significantly limit daily life.
In 2021, 75.7% of people reported no long-term physical or mental health conditions. Another 6.8% reported a condition but were not considered disabled under the Equality Act. Around 17.6% were classified as disabled – split between those whose activities were limited “a little” and those who were “limited a lot.”
General Health
Respondents were asked: How is your general health? Options ranged from “Very good” to “Very bad.”
Just under half of people in England and Wales said they were in very good health, with one third selecting “Good”. Another 13% reported “Fair” health, and 5.2% rated their health as “Bad” or “Very bad.”
Unpaid Care
The census also asked whether people provided unpaid care due to someone’s long-term condition or age. Results show that 8.4% of the population were unpaid carers – nearly 3% providing less than nine hours per week, and over 2.5% providing more than 50 hours.
Demographic context for health insights
As well as the specific questions relating to health, the wide range of demographic data reported by the census can provide additional detail when it comes to health policy and outcomes. Layering in demographic variables – like ethnicity, age or economic activity – helps reveal health inequalities and shape more responsive support.
Ethnicity
Respondents could identify with up to 20 ethnic groups. This granularity helps surface disparities in access, experience and outcomes. For example, 17.8% of Gypsy or Irish Traveller respondents rated their health as “bad” or “very bad” – compared to 5.2% overall.
Additionally, an analysis conducted by the Office for National Statistics also showed that most minority ethnicities have a higher Covid-19 mortality rate relative to the White population in England.
Sex and Age
Data is captured by recorded sex (male or female) and single-year age up to 100+. These variables are crucial in analysing disease prevalence, care needs and service provision, allowing to identify demographics underserved.
Statistics show that, among those providing unpaid care, 10.4% were recorded female at birth, compared to 7.6% recorded male.
Country of Birth and National Identity
Respondents recorded their country of birth and national identity, enabling analysis across migration patterns and regional identification – useful in understanding access barriers and cultural considerations.
This also allows for a better understanding of healthcare trends which result from pre-migration healthcare practices, including outliers in vaccination and screening measures.
Economic Activity, Qualifications and Occupation
The census includes data on employment status, qualification levels and job types. These are key indicators for deprivation, as they reflect access to economic opportunities, educational attainment, and the quality and stability of work available in different areas. When combined with other measures they help build a detailed picture of social and economic inequality, which is a key indicator of health outcomes.
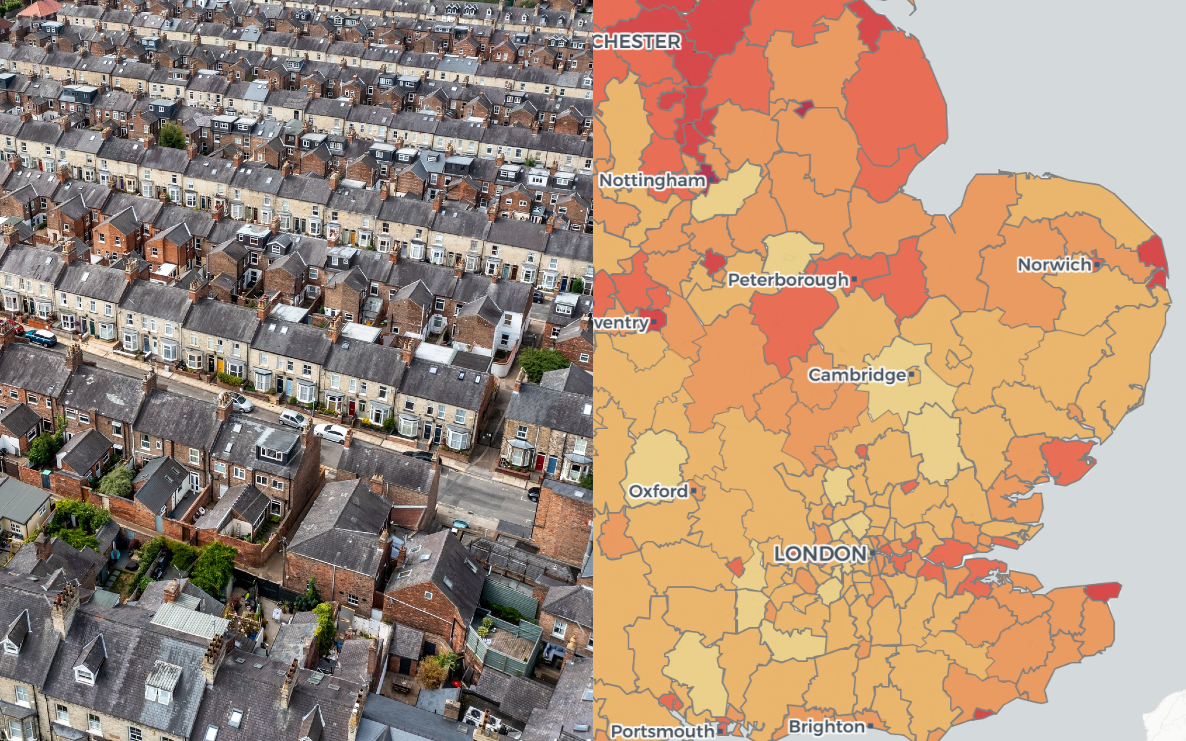
Geographical context for health insights
The key strengths of the census are not limited to demographics, as different geographies also play an important role in considering health trends. This way, the census data tool includes filtering by area type.
Data from the census can be broken down by most geographic boundaries in the UK, from the smallest Output Areas, to the largest boundaries of Regions and Countries.
When it comes to health specifically, Integrated Care Board boundaries will most closely align with other health data published. However, Westminster Parliamentary Constituencies and Local Authority boundaries specifically allow for a more policy focused framing of the data. There is a growing dialogue regarding the need for local authorities to work in partnership with the NHS to improve outcomes, increasing the need for local authority framed health data. Utilising constituency based data from the census will also aid MP engagement, helping to further a policy issue or shift the national narrative on certain topics.
Why it matters for health strategy and geo-advocacy
Census data plays a vital role in identifying population needs, informing service planning, and addressing inequalities. When combined with health data from sources like the NHS, ONS, and Government Departments, it enables more detailed, localised analysis.
Additional public datasets – such as NHS waiting times, chronic illness rates, dementia prevalence, care satisfaction, and deprivation ranks – can further enrich these insights, helping to build a comprehensive, place-based health profile to guide funding, outreach, and policy decisions.
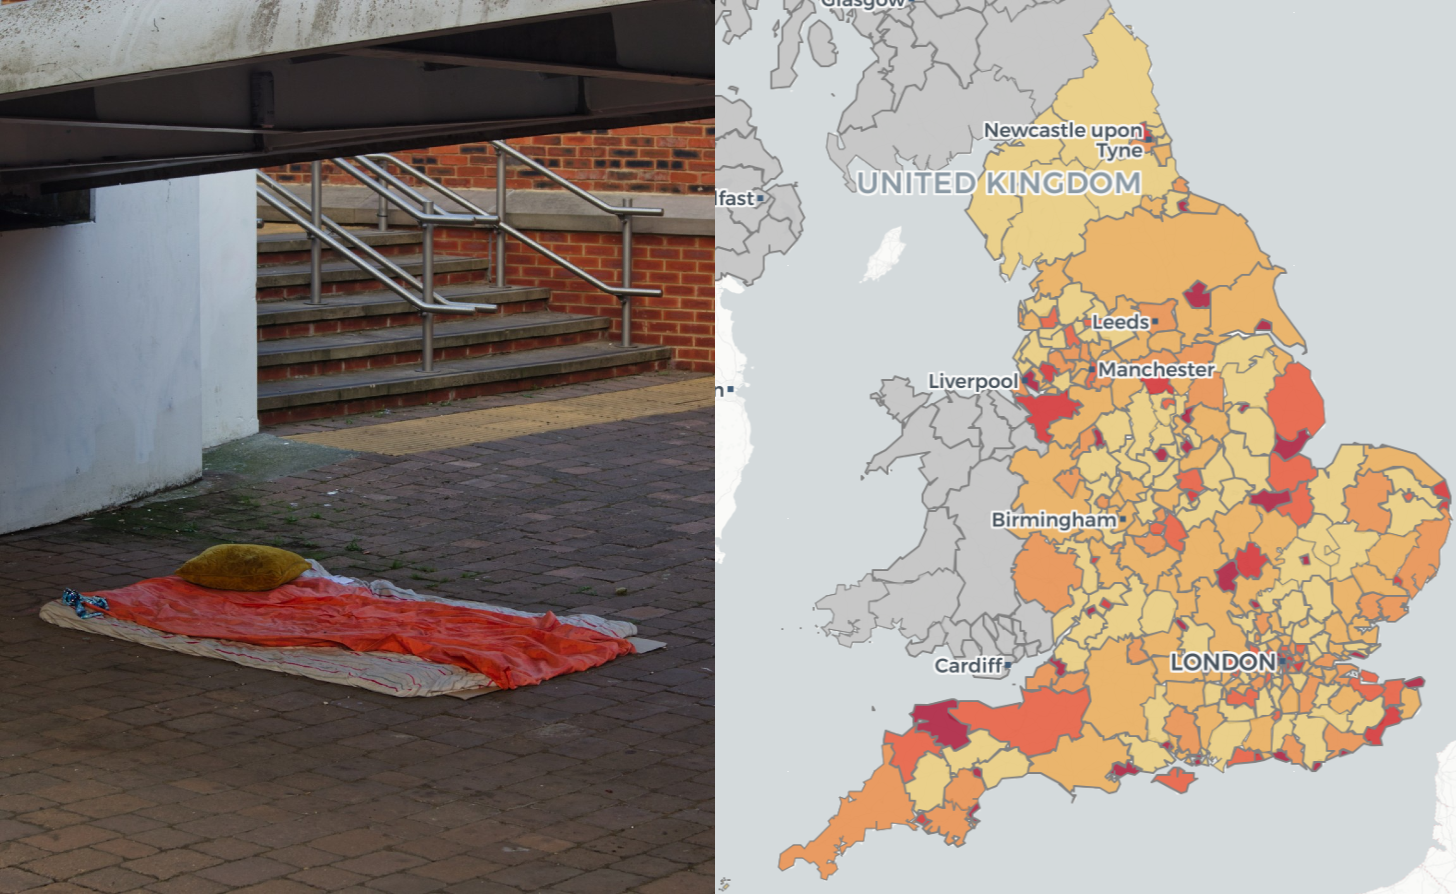
By leveraging various resources, localised pictures can be created and comparison drawn. For instance, if you were to look at deprivation ranks across the country, incorporating health data into your analysis can create a much richer picture of the relationship between deprivation and health, much more than the single ‘health’ deprivation score.
If you take the most deprived local authority of Blackpool and the least deprived authority of Hart, there are clear differences in their health responses, most significantly in physically inactive adults and ‘very good health status’.
This comparative analysis, when done at a national scale can help give more specific suggestions for targeted health measures in deprived areas. Alzheimer’s Research UK (ARUK) demonstrated the potential of harnessing census data to create visualisations on given health topics. Using census population data, alongside NHS dementia prevalence figures, they generated dementia prevalence estimates for every parliamentary constituency in the UK.
This data-driven initiative enabled ARUK’s policy team to engage MPs and stakeholders with highly localised insights, achieving significant attention. The direct use of granular, localised data provided crucial context, informing relevant discussions on Dementia.