We’re often told that MPs love constituency-level data. For many organisations, the challenge isn’t convincing parliamentarians of its value—it’s figuring out how to source relevant localised statistics in the first place.
At Polimapper, we build tools that make that part easier. And while we know from experience that good data gets used—in emails, briefings, media releases and speeches—it’s not always easy to point to a single moment and say: this is where it made a difference.
So when such moments do happen—and when they’re written into the parliamentary record—it’s useful to highlight them.
This is exactly what happened recently, when Alzheimer’s Research UK told us their Dementia Statistics Hub maps, built using Polimapper’s platform, had helped MPs prepare for a Commons debate on dementia care.
Putting data at MPs’ fingertips
The Dementia Care debate took place on 3rd June 2025, timed to coincide with Carers Week and was initiated by Caroline Voaden, MP for South Devon. The aim was to shine a light on how many people with dementia diagnosis receive a formal diagnosis, access to care, support for carers, and the scale of the challenge posed by dementia in every part of the UK.
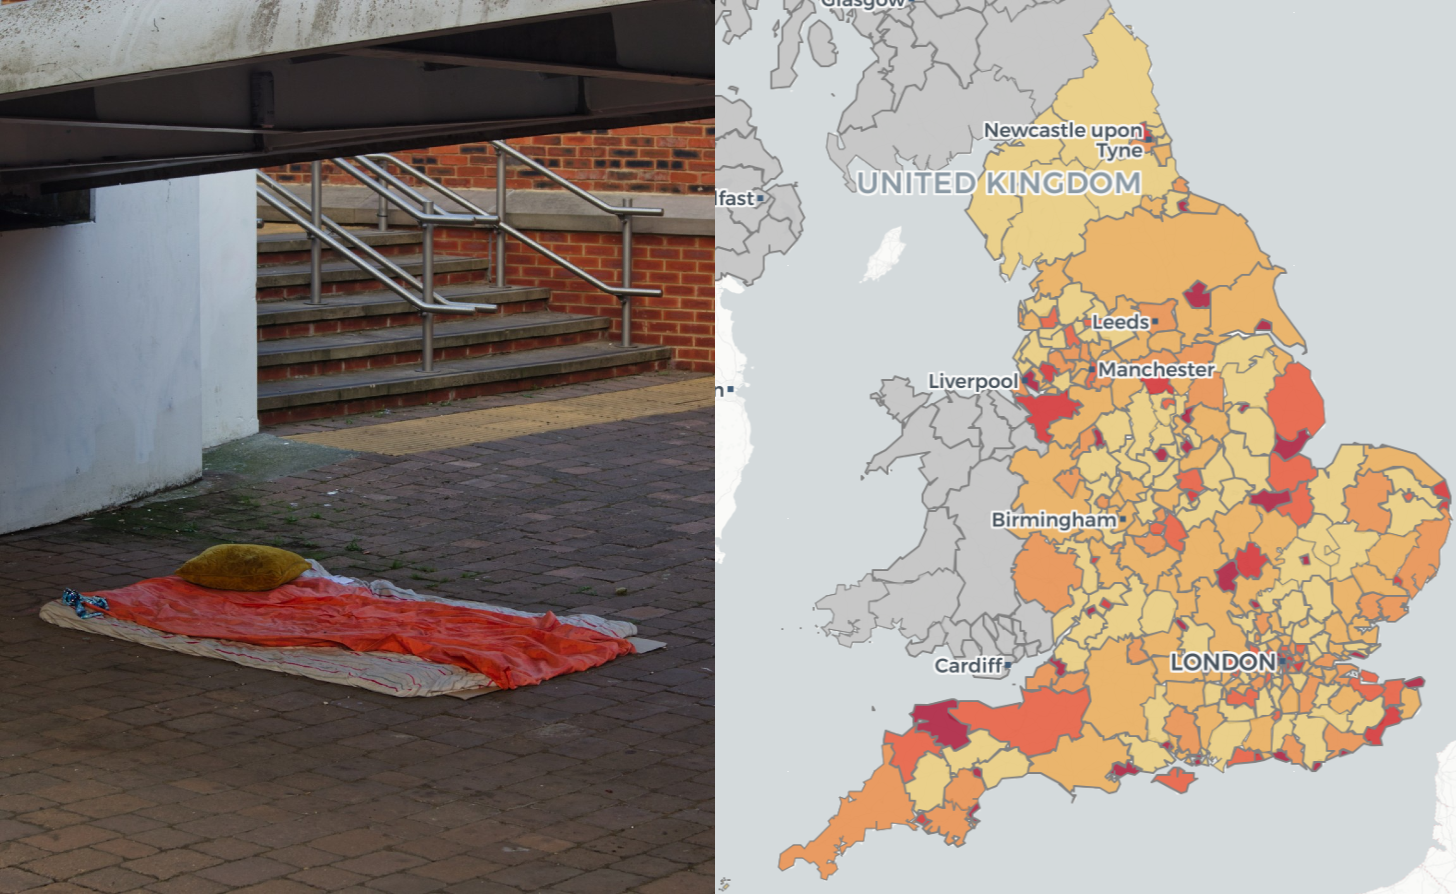
Alzheimer’s Research UK’s dementia statistic hub—powered by our interactive constituency visualisation tools—provided MPs with accessible statistics on the estimated number of people living with dementia in their constituency waiting times and regional variations. The data helped speakers ground their remarks in local context, reinforcing the case for change.
This is something we see regularly: organisations equipping MPs with constituency-specific information that gives national issues local weight. But this time, the connection was plain to see—and publicly available.
From dashboard to debate
Several MPs in the debate drew directly from Alzheimer’s Research UK’s figures, using them to spotlight conditions in their own areas:
- Manuela Perteghella (Stratford-on-Avon, LD) noted that 1,800 people in her area are living with dementia and highlighted care system gaps raised by local constituents.


- Chris McDonald (Stockton North, Lab) told the House that people in Stockton wait six weeks longer than average for a diagnosis—a data point that speaks volumes about regional inequality.
- Rachel Gilmour (Tiverton and Minehead, LD) cited 1,877 local residents living with dementia—well above average—and spoke about how rural isolation and lack of services compound the issue.
🔗 Dementia in Tiverton and Minehead
- Jo Platt (Leigh and Atherton, Lab/Co-op) described the experiences of 1,422 people in her area, where dementia prevalence ranks 281st out of 650 constituencies.
🔗 Dementia in Leigh and Atherton
- Brian Mathew (Melksham and Devizes, LD) shared that 1,638 residents are living with dementia and reminded the chamber that behind each statistic is a family, a carer, and a story.
🔗 Dementia in Melksham and Devizes
A clear example of what’s possible
This debate isn’t a one-off—but nor can we pretend it happens every time. The reality is that even the best data doesn’t guarantee airtime in Parliament. What it does do is improve the chances: the clearer and more local the evidence, the easier it is for MPs to use it—whether that’s in speeches, correspondence, or casework.
The Dementia Care debate is a useful and public example of what’s possible when constituency-level data is made accessible and relevant. It shows how turning national challenges into local stories gives them greater weight in Westminster—and how MPs will use good data when it’s placed at their fingertips.
Insights from Alzheimer’s Research UK
After the debate, we caught up with the team at Alzheimer’s Research UK, to hear more about the impact of their data visualisations.
How have the visualisations helped your engagement with MPs?
“The visualisation of data has been instrumental in our engagement with MPs whether in one-to-one meetings, as part of takeaway leaflets at our parliamentary events, or in our regular communications through our Dementia Research Champion Network. The ability to break down data by region and constituency has been especially valuable, helping us make the statistics directly relevant to each MP’s area, something we’ve received positive feedback on. Graphs and maps have also made our message more tangible, both for us and for Parliamentarians.
They are also helping us moving forward. We have launched our Dementia Unseen campaign and public petition focusing on dementia diagnosis and the statistics help us to bring the campaign to an MP’s local area and highlight regional disparities.”
What led to the MPs using the maps ahead of the debate?
“Our lobbying ahead of the recent Dementia Care Debate, including targeted meetings with MPs, tailored communications via our Dementia Research Champions Network, and detailed pre-debate briefing materials played a key role in shaping the discussion. The visual data from the constituency-level maps was central to our briefing and used during the debate by several MPs who referenced the number of people living with dementia in their constituencies and citing our maps as a source. The Stats Hub has also proved to be a useful tool. We’ve noticed that some MPs we hadn’t actively engaged with had clearly accessed it themselves to look up their stats. Having it in the public domain adds value behind the scenes, helping inform and influence even without direct outreach.”
What was your reaction to MPs referencing the Alzheimer’s Research UK data?
“We were absolutely delighted to see so many MPs referencing the Alzheimer’s Research UK data. It’s hugely encouraging to see our work recognised in Parliament, not just for us, but for our supporters who are at the heart of everything we do.”
Explore the Data
The full Dementia Statistics Hub is publicly available here:
🔗 Dementia Statistics Hub | Alzheimer’s Research UK
Or view the data on our platform here:
🔗 Polimapper Visualisation Tool – Dementia Prevalence
Polimapper is proud to support organisations turning complex data into compelling stories—and helping move them from spreadsheet to Hansard.


