NHS sees slight increase in waiting lists after a year of improvement, amid doubts over healthcare needs being met.
The latest NHS waiting times data follows a Nuffield Trust report showing that recent improvements in waiting lists are not necessarily due to improved treatment delivery, but rather to a higher number of appointments being removed from the lists.
This morning, NHS England published new referral to treatment waiting times data for June 2025, revealing 7.37 million open pathways in the month, an increase of 10,000 compared to the previous month. As some patients are on multiple pathways, the number of unique patients is estimated to be around 6.2 million.
Additionally, the percentage of pathways completed on time increased from May to June, to 61.5%. Nonetheless, this is still far behind target. The target sets out that 92% of people waiting for non-urgent treatment should wait no longer than 18 weeks from referral to first treatment.
While the average wait remained at 13.6 weeks, over 190,000 people have already been waiting for more than a year.
Out of all treatment functions, the Elderly Medicine Service and the Mental Health Services performed the best, meeting target in a number of Care Boards.
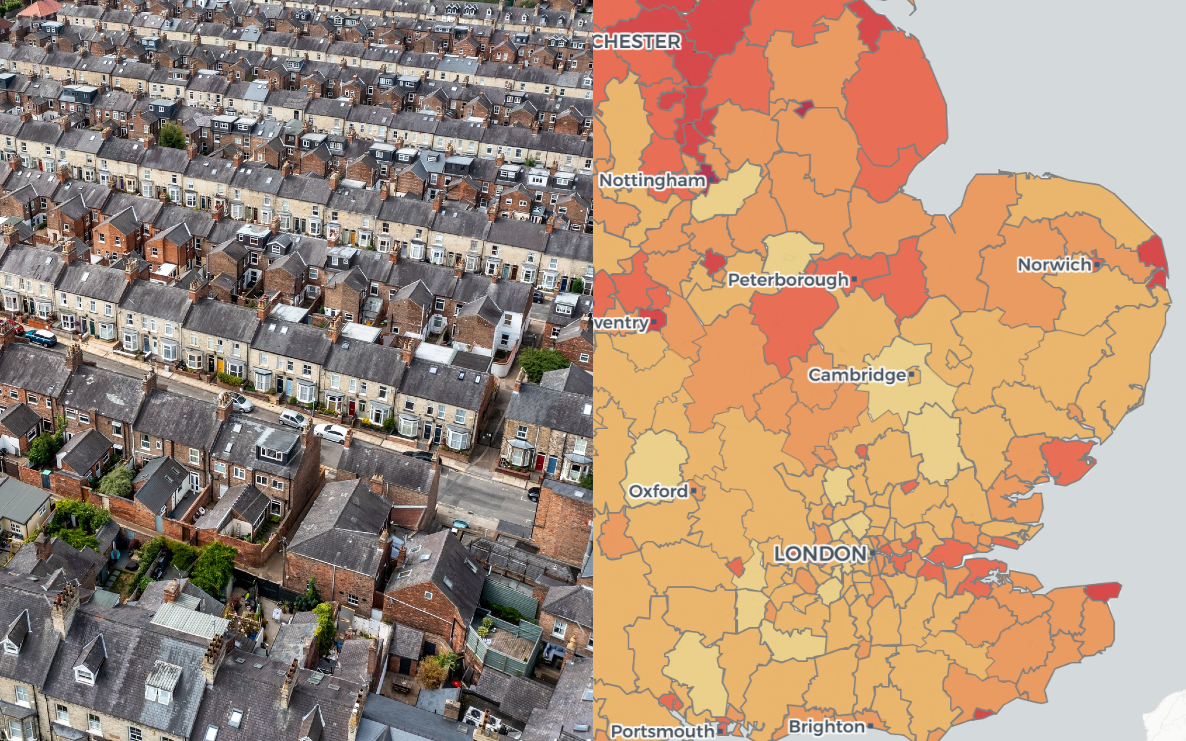
The data team at Polimapper has visualised NHS Waiting Times figures in England, showing geographical trends.
In England, the North East and North Cumbria Care Board performed best, registering 71% of pathways closed within 18 weeks. Conversely, the Mid and South Essex ICB saw the worst target rates, at 52.5%.
About this map
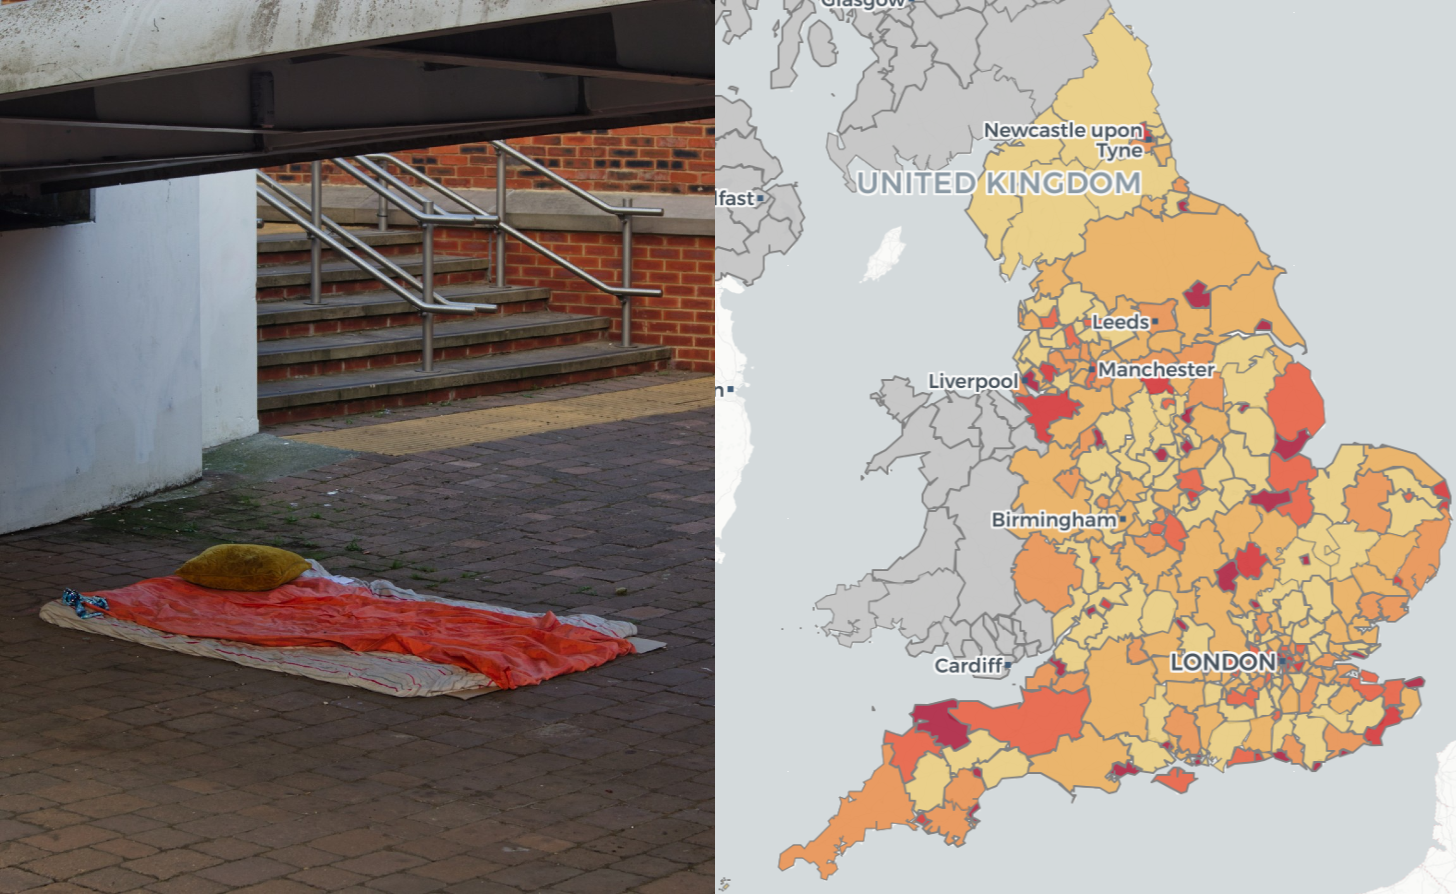
The visualisation below shows NHS waiting times figures by Integrated Care Board in England.
To explore statistics in your area double click on the map or use the link.
Geodata context
The new report from the Nuffield Trust shows that 245,000 NHS appointments were being removed every month because patients had died, began treatment elsewhere or moved abroad, rather than due to treatment being delivered by the healthcare service.
Commenting on the data and their latest analysis, Dr Becks Fisher, director of research and policy at Nuffield Trust: “Today’s figures show that the NHS waiting list has gone up slightly after falling over most months this year. It remains stubbornly high at 7.37 million and the NHS is struggling to keep pace with demand.
“But the reported numbers on the planned treatment waiting list only show part of the picture. Our new analysis shows that waiting list reductions in previous months are not wholly due to increases in appointments being delivered. In fact, the NHS is still treating fewer patients than are being referred. But, an average of about 245,000 cases have been coming off the list each month due to reasons other than patients being recorded as getting their treatment. Doing this work to improve the accuracy of the waiting list is important, but we should be under no illusions that despite delivering more appointments, the NHS is still not meeting patient demand.”
“The Health Secretary has praised “record investment and fundamental NHS reform” as the reasons behind reductions in the waiting list earlier this year, but there are lingering background causes that go unmentioned.”
“We know from our analysis of the British Social Attitudes Survey that long waits for hospital care are core to falling public satisfaction with the NHS, so the Government is absolutely right to focus on driving down waiting times. But at present it is not clear from this data how much progress is really being made, amid continued growing demand for planned treatment. We need more transparent reporting otherwise the waiting list is an incomplete picture of how the NHS is dealing with the backlog.”