EU stakeholder visualisation
Winning the attention of MEPs or European Union officials starts with evidence they can absorb at a glance.
Polimapper’s EU stakeholder visualisation transforms your key advocacy data into interactive maps and stakeholder dashboards that speak the language of Brussels based decision-makers.

Why data-driven advocacy moves policy
MEPs and Commission officials are inundated with claims.
Show them a map that pinpoints the impact on their own region and the conversation shifts from theory to tangible consequence.
Localised visuals give your briefing the credibility and urgency needed to secure meetings, win cross-party backing, secure funding, or keep amendments alive through committee stages.


Sample use cases
Say goodbye to overtly complicated dashboards
Health data visualisation
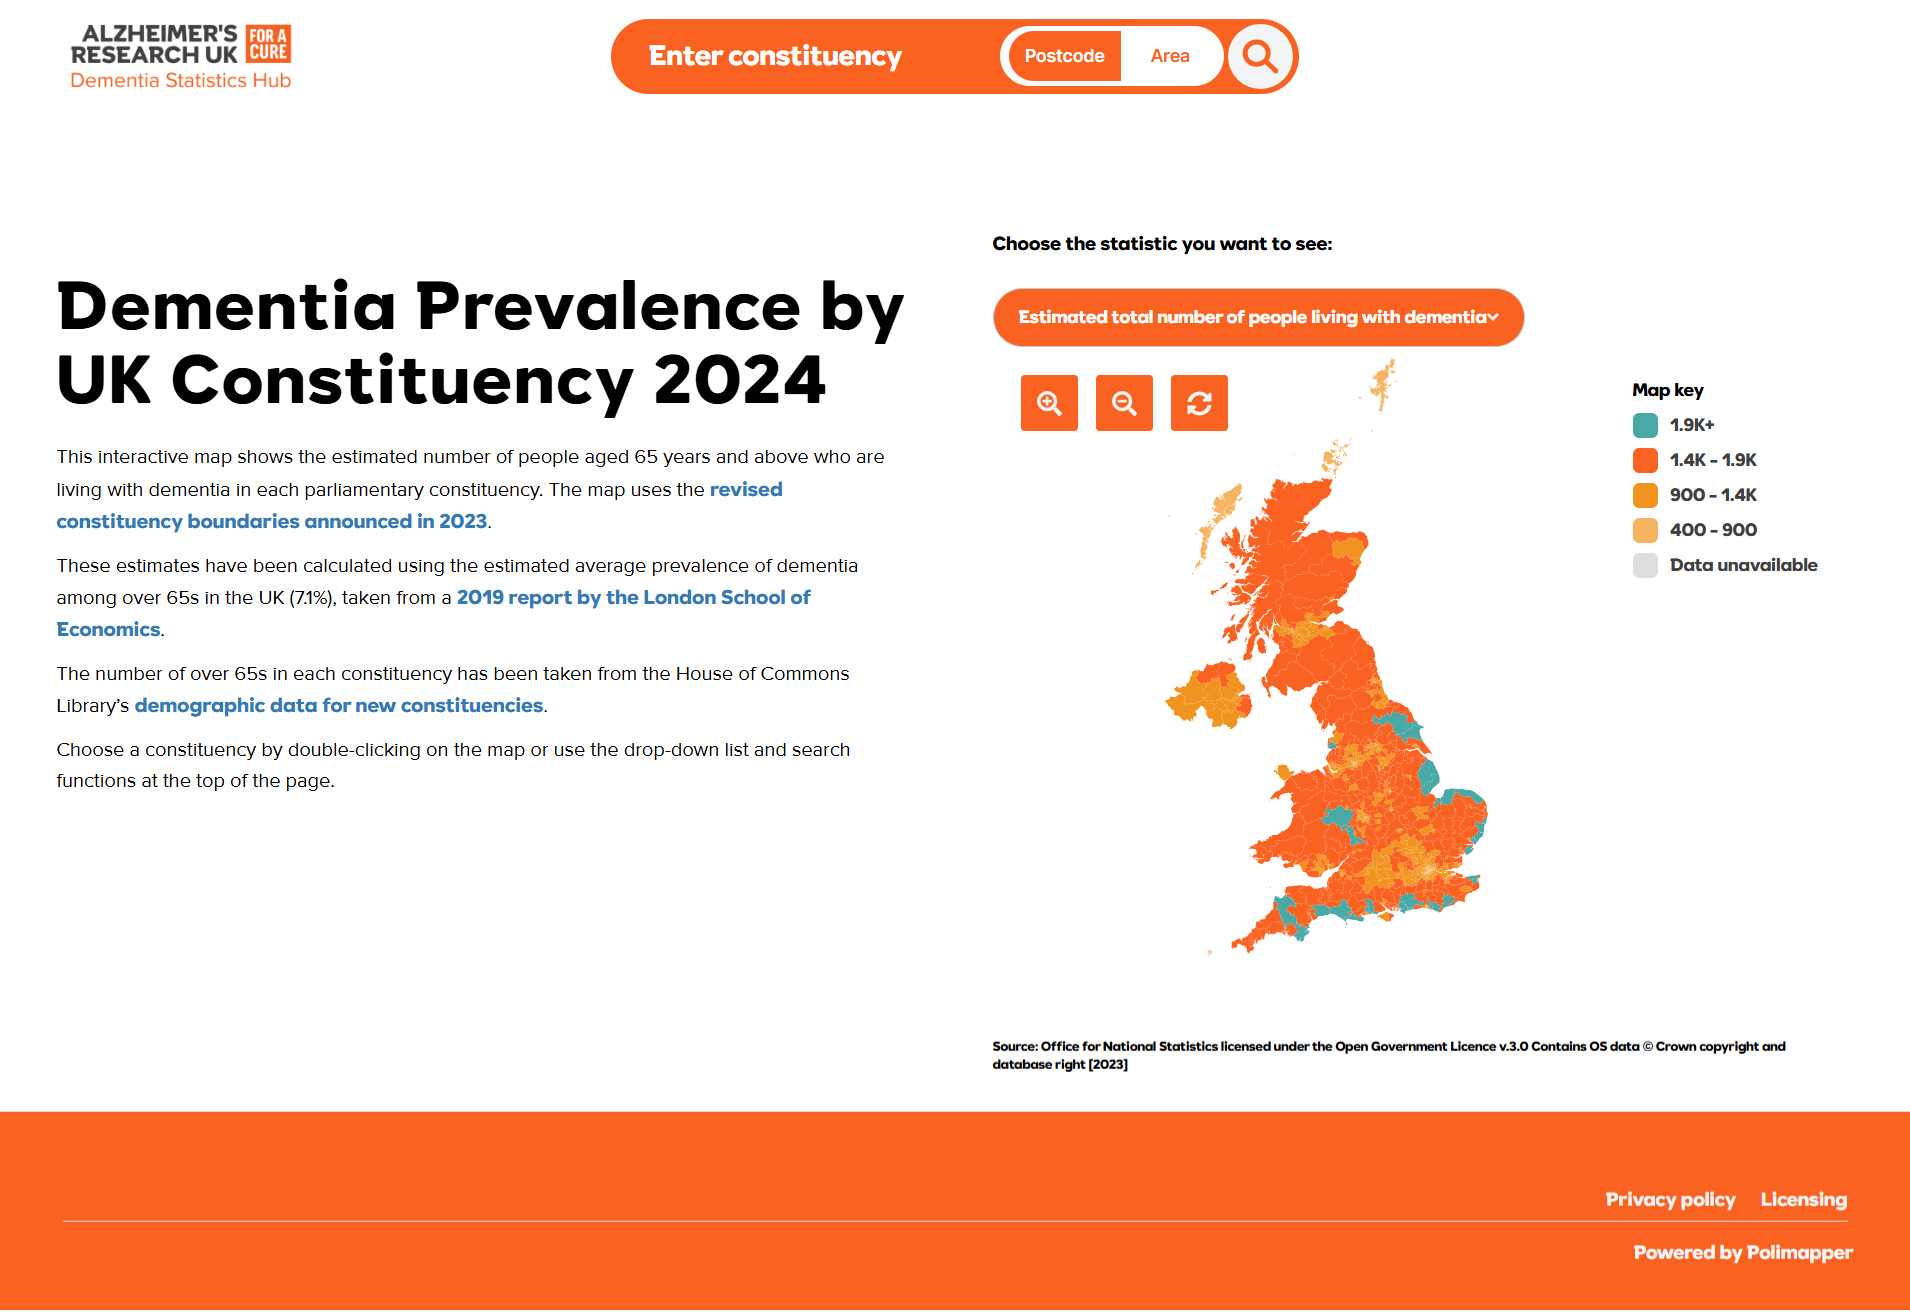
Map Eurostat morbidity data that shows the prevalence in particular areas of a rare respiratory disease. The disparities persuade regional MEP to co-sponsor a Horizon Europe amendment for extra research grants.
Employment data visualisation
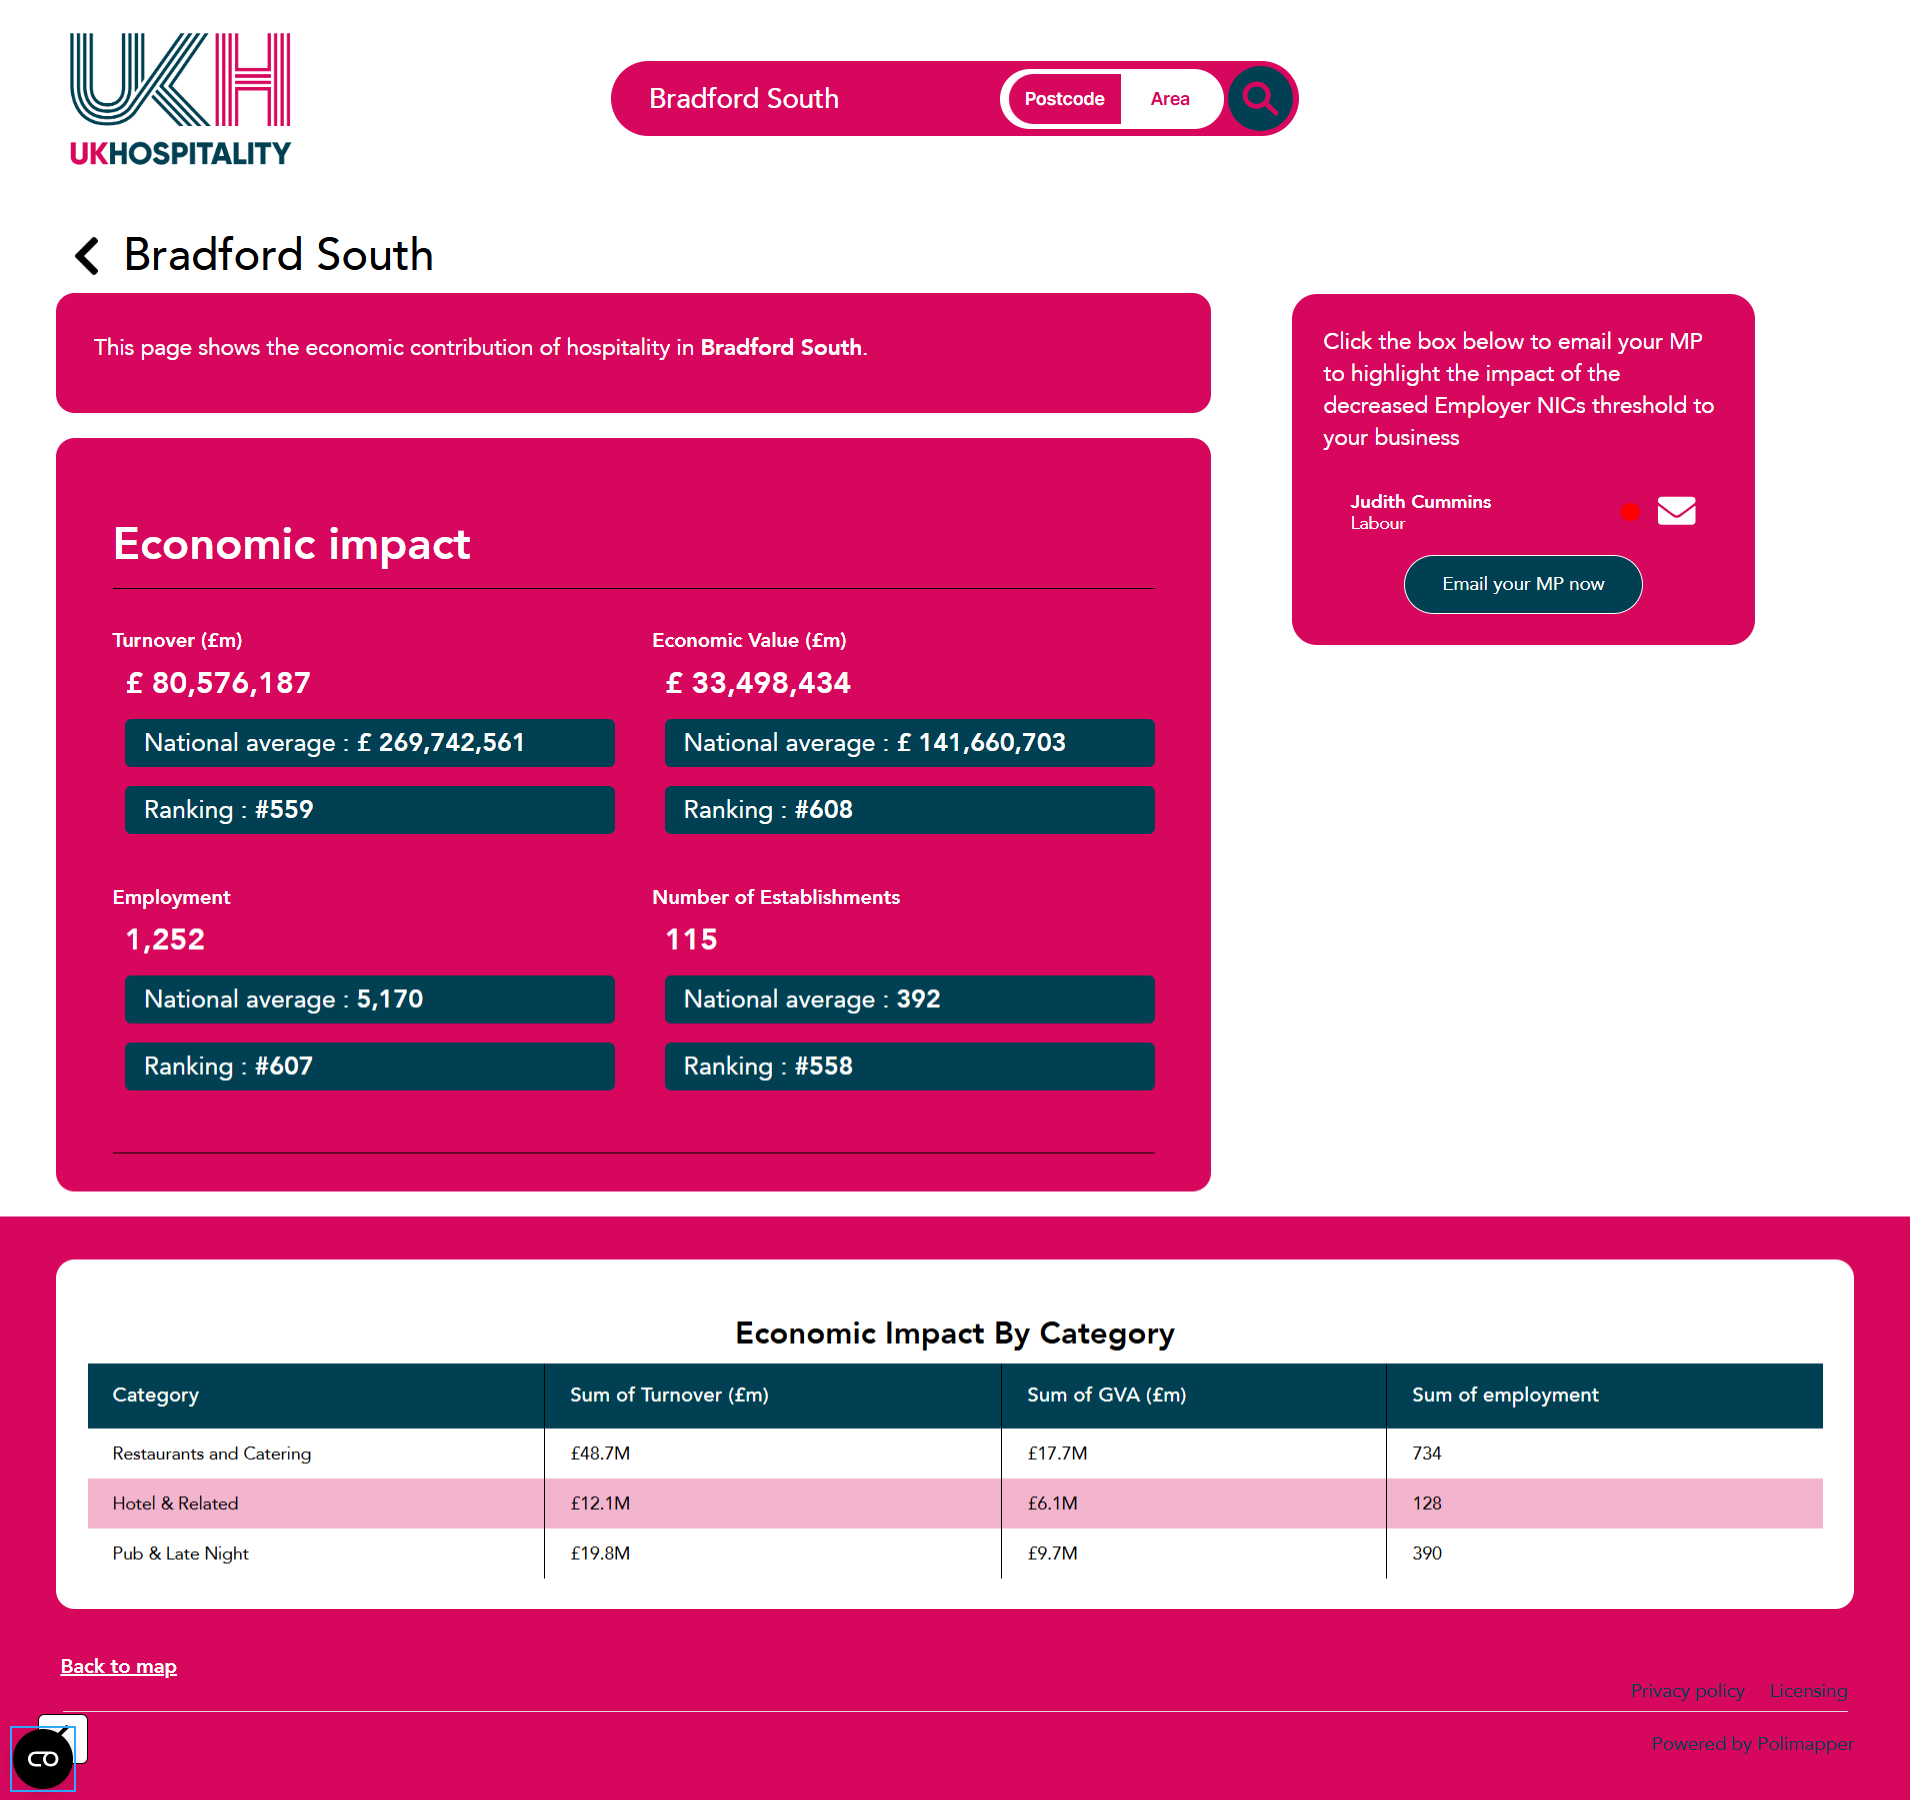
Map quarterly labour statistics to spotlight pockets of youth unemployment across border regions. Apply this evident during eMPL committee hearings to highlight how many jobs a pilot apprenticeship scheme could create in each constituency, earning cross-party support.
Infrastructure need mapping
Layer GIS data on unfinished rail links and demographic growth to showcase how to a particular fast growing region lacks direct connections to the TEN-T core network. Deploy these visualisations to convince the TRAN Committee to include the route in the next funding envelope.
From Brussels to the web
EU Connect is a versatile web-based service that is equally at home:

Providing interactive dashboards for 1-2-1 meetings and corridor chats

On touch-screen TVs and iPads at European parliament events and receptions

As a key geographical resource within your website

As a password protected data portal
No code and easy embedding
Use Polimapper EU Connect to create engaging visualisations:
- Without the need for graphic designers
- Without the need for web developers
- It can easily be embedded seamlessly into websites in a format to suit you using our custom embed code generator.


Self-serve or managed options
Polimapper is designed to be a self-serve tool, enabling you to create visualisations quickly, as and when you need them.
However, if you’re looking to save yourself even more time, the Polimapper team can take care of everything for you – from sourcing data to building the visualisation.
Our managed packages can also be used for the creation of PDF constituency data summaries.
Trusted across sectors
Brussels based NGOs, European trade associations and global corporates rely on Polimapper to simplify stakeholder communications and keep advocacy agile.
With EU Connect removing technical hurdles, your team stays focused on strategy, negotiations and relationship building while we handle the heavy lifting of data visualisation and outreach automation.


Try Polimapper for free today
Experience how quickly your data can start working for you in Brussels. Get in touch today.
Having trouble finding data?
If you’ve having trouble finding EU member state data, don’t worry: speak to a member of our team.
